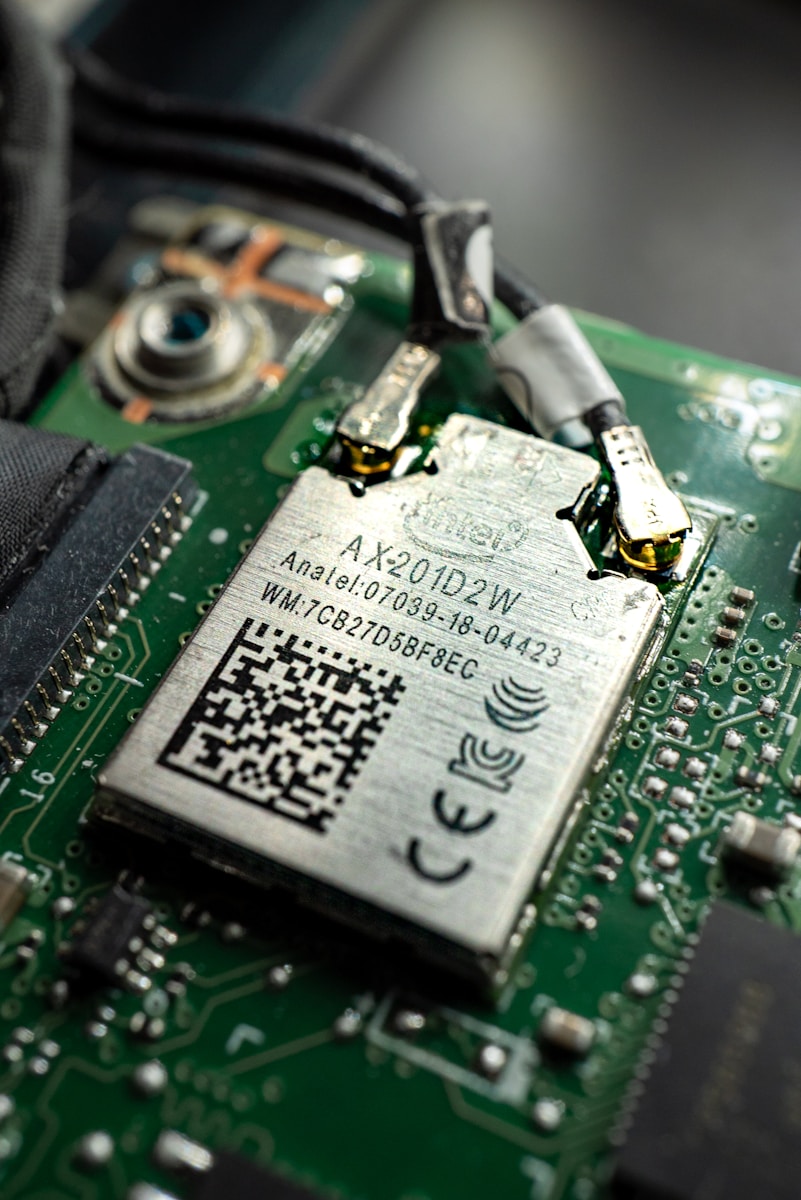
Imagine a tiny bearing in your main pump starting to wear down. You can’t hear it. Routine checks won’t find it for weeks. But a thumbnail-sized vibration sensor can feel the tiny shock in milliseconds. It notices the change, flags a rising vibration trend, and gives you days, sometimes weeks, to schedule a controlled shutdown.
That is the power of vibration-based predictive maintenance. It starts with knowing how these sensors work.
Why Vibration Signals Reveal Machine Health
Every rotating asset (motors, pumps, gearboxes) produces its own vibration “fingerprint”. When parts loosen, wear, or move out of alignment, that fingerprint changes long before breakdown.
Vibration sensors convert that mechanical motion into an electrical signal. Software compares it to a normal baseline. Even small changes can warn your maintenance teams early, giving you time to fix the problem before it grows.
Key Benefits
- Earliest warning – Detects issues weeks before temperature or pressure sensors.
- No downtime to install – Mounts outside the machine; no process stoppage.
- Covers all failure types – Imbalance, misalignment, looseness, bearing wear.
- Straightforward ROI – Typical payback is under 12 months.
Core Sensor Types and What Each Measures
Choosing the right sensor is half the job. Below are the most common types and when to use them.
Piezoelectric vs. MEMS Accelerometers
| Feature | Piezoelectric | MEMS |
| Frequency Range | Up to 20 kHz | 0–5 kHz |
| Sensitivity | High | Moderate |
| Size | ½ inch+ | Thumbtack |
| Cost | $$ | $ |
| Best For | Turbines, high-speed gearboxes | IIoT retrofits, battery-powered nodes |
Velocity & Displacement Probes
For slow-speed equipment (under 600 RPM), velocity sensors or eddy-current displacement probes work better than accelerometers. They detect low-frequency movement, which often shows up when bearings start to fail.
A 2023 study called Highly Reliable Multicomponent MEMS Sensor for Predictive Maintenance Management of Rolling Bearings shows that a low-cost MEMS accelerometer prototype, calibrated from 10 Hz to 25 kHz, can monitor bearing vibration. The test found the sensor could detect fault signals in both time and frequency data under lab conditions.
Step-by-Step: From Raw Vibration to Actionable Alerts
Below is the typical workflow our clients follow, feel free to adapt it to your environment.
1) Sensor Placement & Mounting
Start by placing the sensor as close as possible to the part under load, usually the bearing or motor drive end. For high-frequency measurements, stud mounting works better than using adhesive pads. It is also important to align the sensor’s X, Y, and Z axes with the shaft plane so you get cleaner data that’s easier to analyze.
2) Signal Conditioning & Edge Computing
Inside the Camali VS-200 node, a built-in charge amplifier conditions the signal. Then, a 24-bit ADC samples it at up to 25.6 kHz. Built-in edge firmware performs a FFT (Fast Fourier Transform), a mathematical tool that breaks vibration data into frequencies before wireless transmission, reducing the amount of data sent and enabling more efficient vibration analysis at the edge.
3) Cloud Analytics & AI Thresholds
Processed data is sent to the Camali Cloud via MQTT. Our anomaly-detection model compares live metrics to a baseline that accounts for load and temperature. When it spots a problem, the workflow engine creates a work order in your CMMS and emails a CSV of the data to maintenance.
ROI You Can Expect (Real Numbers & Case Study)
Case Study – Midwest Plastics Extrusion Plant
At a Midwest plastics extrusion plant, maintenance staff monitored 47 extruder motors (each 75 HP) using 94 MEMS tri-axial sensors. The system detected a coupling misalignment 18 days earlier than it would have otherwise, potentially avoiding a costly unplanned outage. As a result, the plant realized a payback in under a year and saw ongoing reductions in downtime.
Typical ROI Benchmarks
| Metric | Improvement |
| Maintenance labor hours | ↓ 20% |
| Spare-parts cost | ↓ 10–15% |
| Asset life extension | ↑ 20% |
Choosing the Right Sensor: 6-Point Checklist
- Frequency Range – Ensure at least 2× your highest expected fault frequency.
- Dynamic Range – 80–100 dB for heavy-duty machines.
- Mounting Style – Stud, magnet, or adhesive?
- Environment – IP rating, temperature, chemicals.
- Power & Connectivity – Wired 4-20 mA, BLE, or LoRaWAN.
- Native Analytics – Edge FFT and envelope detection save cloud costs.
Not sure which fits? Talk to an engineer » and we’ll model which sensor architecture fits your RPM, load, and environment profile.
Key Takeaways & Next Steps
- Vibration changes are often the first sign of mechanical failure.
- Piezoelectric and MEMS accelerometers turn motion into trackable signals.
- Edge analytics + AI thresholds turn raw data into actionable alerts.
Next Step: Schedule a 30-minute demo to start avoiding surprise shutdowns.


